Graphviz: easy graph visualization
(Ad, please don’t block)
This tool has been around for a while, but I still like how useful it is, so I thought I'd write a blog entry about it: Graphviz translates simple textual representation of graphs into diagrams. Visually, this covers everything where shapes are connected by lines (be it with or without arrows), which is quite a lot.
Example: The definition
digraph G {
    TODO -> "Buy food" ;
    TODO -> "Send out invites" ;
}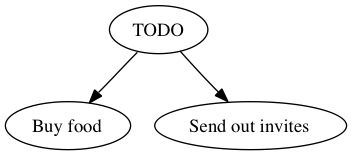 Notes:
- The definition (and input of Graphviz) is just a text file which can be easily created by a program.
- The GUI version of Graphviz watches files so the diagram will be updated automatically every time the text file changes.
- Graphviz can export its visualizations in many formats (jpg, PDF, SVG, ...).
- More examples: Graphviz Gallery, UML Diagrams Using Graphviz Dot.
- Download (be sure to use one of the “Executable Packages from AT&T”).